Student Performance Factors: Visual Analytics Dashboard
Course: Interfaces for Info Visualization & Retrieval, MS HCC
Overview:
Process & Contributions:
The project investigated key factors influencing student academic performance using a Kaggle dataset of 20+ variables spanning study habits, attendance, income, parental involvement, and lifestyle choices. The goal was to design a set of interactive Tableau dashboards that reveal insights into learning outcomes and provide educators with actionable tools for early intervention.
1. Data Preparation
Cleaned and standardized dataset entries (e.g., gender labels, duplicate removal, missing values filled using consistency-based methods).
Grouped and merged categorical variables (e.g., age ranges, education levels) to improve clarity and reduce redundancy.
Loaded the processed dataset into Tableau for dashboard development.
2. Dashboard Design & Visualization
Designed four interactive Tableau dashboards, each tied to a guiding research question:
Key Factors Influencing Student Performance – Bar Graphs comparing average exam scores against hours studied, sleep hours, and physical activity.
Socioeconomic Factors vs. Academic Success – Box & Whisker Plots highlighting performance disparities by family income and parental education.
Attendance Frequency vs. Performance – Scatter Plots revealing correlations between attendance and exam scores.
Gender-Based Differences in Performance – Tree Maps visualizing proportional contributions of male vs. female students to performance outcomes.
3. Usability Testing & Feedback
Conducted think-aloud protocol sessions, pre-post evaluations, and semi-structured interviews with two participants (a student and a data analyst).
Insights gained:
Bar graphs and scatter plots were highly effective for trend interpretation.
Tree maps were less intuitive for precise comparisons, and box plots posed challenges for non-technical users.
Suggested improvements included clearer axis labels, refined color coding, and increased interactivity with tooltips and filters.
Iterated the dashboards accordingly, simplifying complex visuals and enhancing chart clarity.

DASHBOARD

BAR GRAPHS

BOX & WHISKER PLOTS
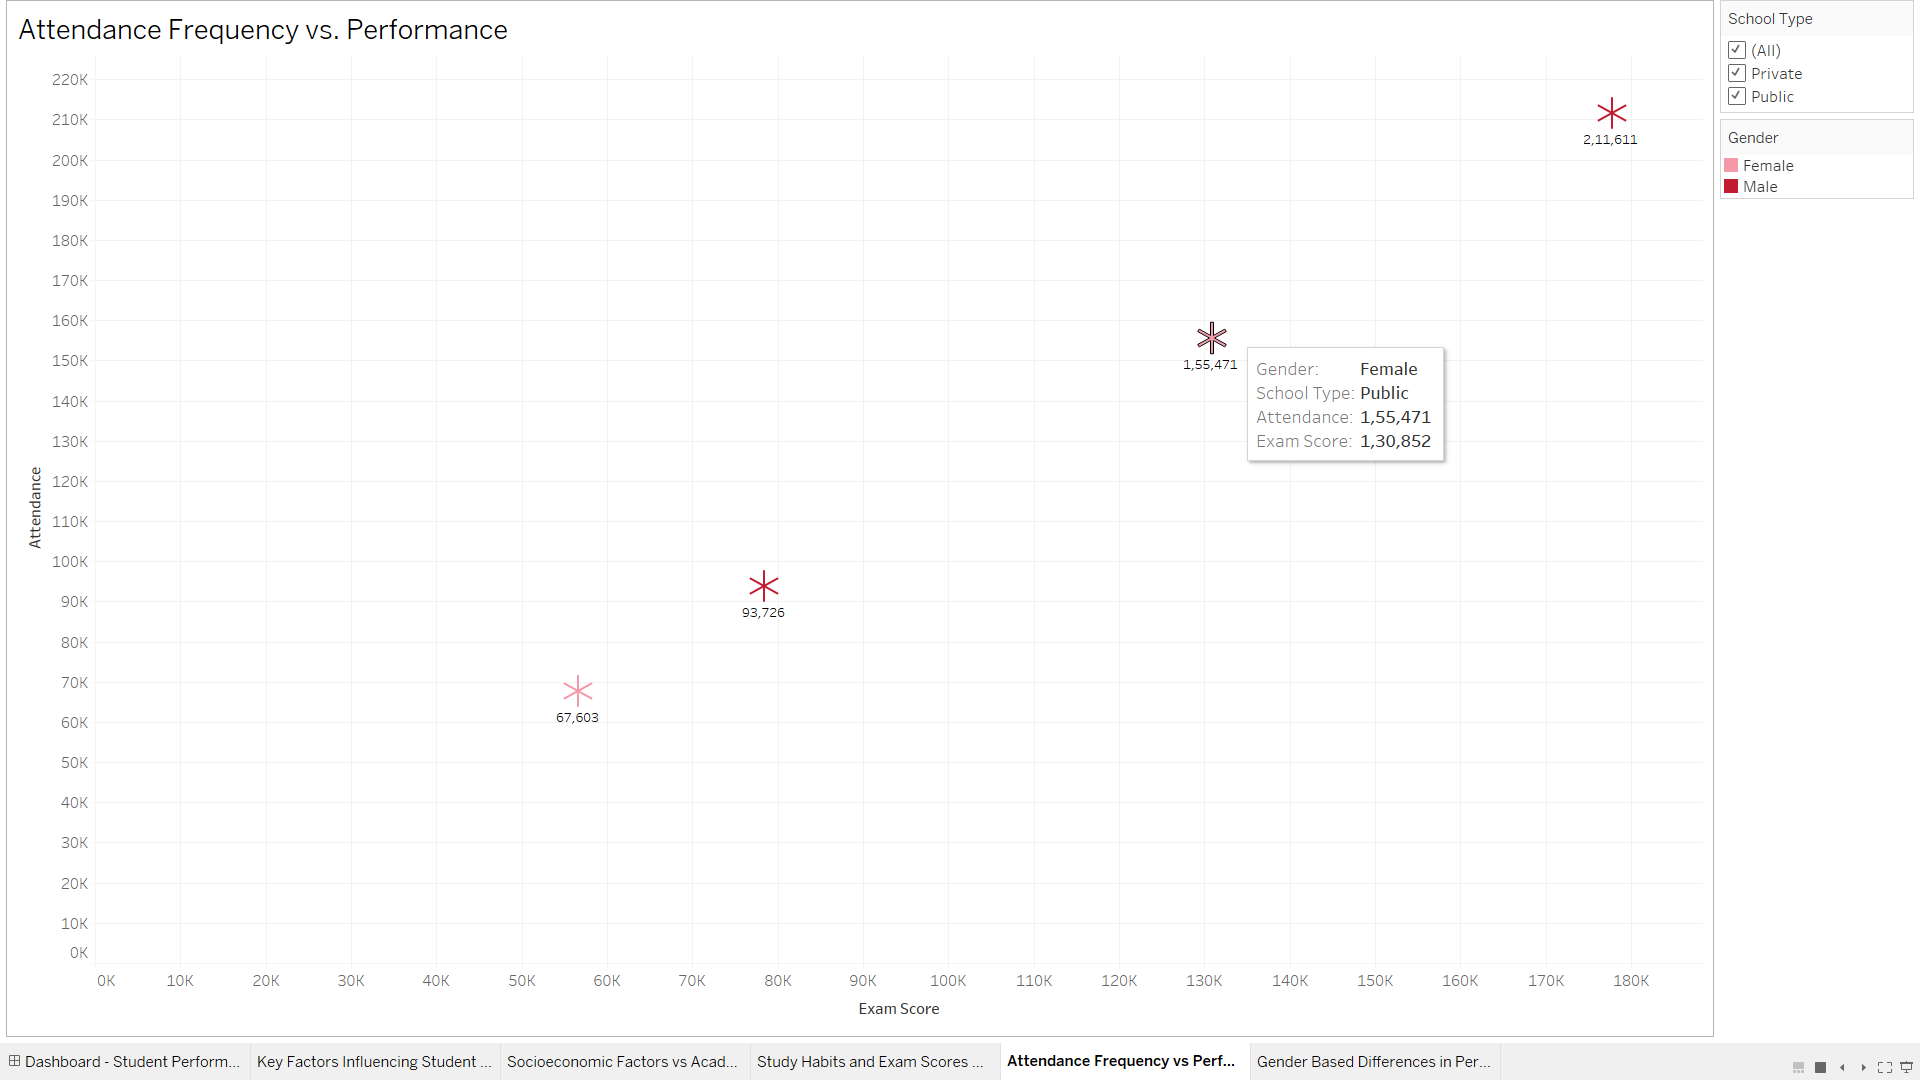
SCATTER PLOTS
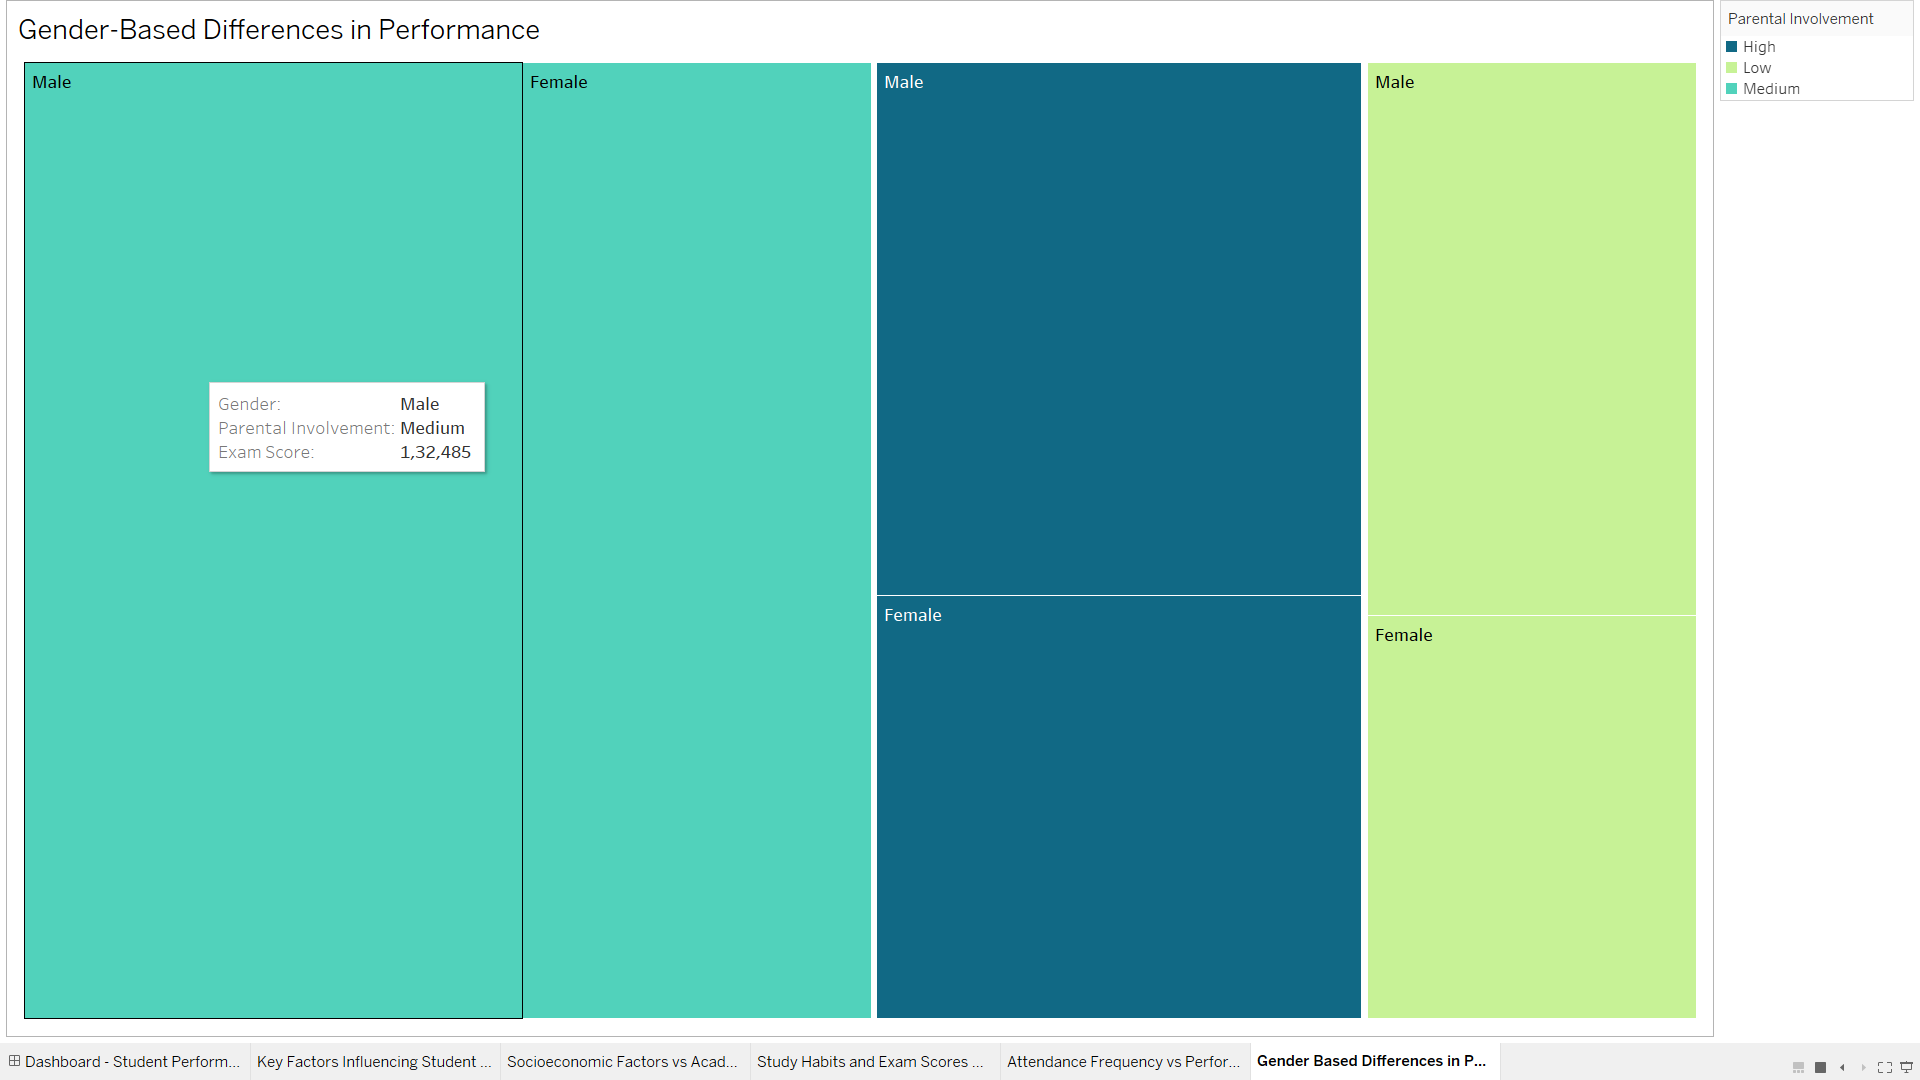
TREE MAPS
Outcome & Impact:
Delivered 4 interactive dashboards that uncovered trends across demographics, study habits, attendance, and socioeconomic conditions.
Achieved 100% task completion rate in usability testing, with participants affirming the dashboards’ usefulness for educators and policymakers.
Improved label clarity, interactivity, and hierarchy, leading to strong endorsement for use in educational interventions.